
Is Block Liquidity in the US as Dry as They Say?
Let's deep dive.
There has been much chatter of late on the drying liquidity in the marketplace, in particular when it comes to block shapes and even more magnified when dealing with the middle of the day vacuum.
One of the more salient data points to reflect the rising cost of trading seen in recent days, and drying liquidity, is simply the depth of market in the S&P 500 E-minis market. One article1 cites the September 21 depth of $34MM two sided having moved to $3M today―a tenfold decrease in the most highly of traded e-mini contracts.
Now, that certainly makes sense. Volatility has subsided considerably in just a week’s time but the real price volatility is anything but docile. The lack of liquidity is likely to exacerbate the midday moves, to widen spreads to compensate for market maker risk, to grow fear of adverse selection amongst traders, and overall depth to drop considerably.
And while the shock and volume increased three weeks ago, largely driven by monetary policy, the V-shaped midday misdirection subsided quickly―even more so in individual stock situations. However, using the major indexes as a proxy, the chart below shows this burst of daily movements in the S&P 500 can rival any period coming out of the initial Covid shock of February 2020. Just last week, with little headlines and volumes 30% lower than the aforementioned FOMC week, the standard deviation move on the SPY was 0.7%―not a huge conviction signal, but pretty decent considering the lack of volume and headlines.
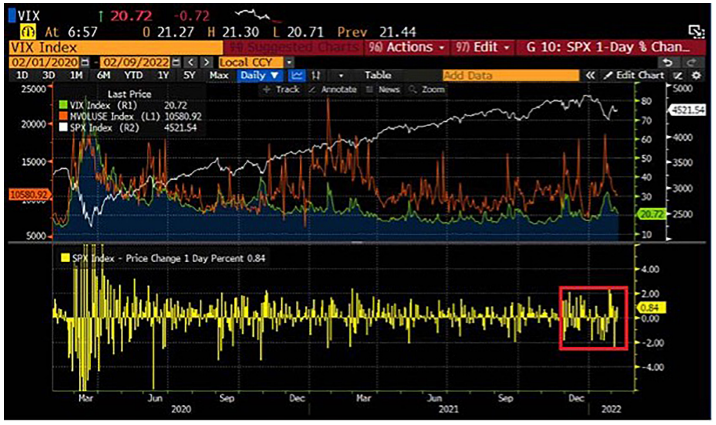
Source: Bloomberg
Much credit was given to the volume burst mid-January to ETF volumes. There may be some credence to that, and also to the thought that retail participation was using the more popular ones (i.e. SPY, QQQ, UVXY, VXX, etc.) as market conditions. That said, most volume trackers would point to significantly lower retail participation at the moment. In the context of higher cost to trade and declining block size liquidity, it is worthwhile to run a cost to trade model. Liquidnet Equity Analytics below reflect the rising costs, but also note the current quick reversion to the mean―high on January 24 and currently moving in.
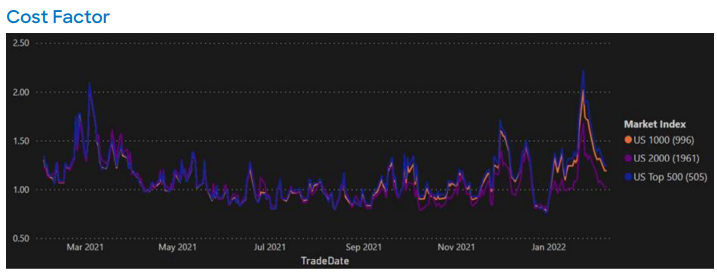
Source: Liquidnet Equity Analytics
It is important to keep in mind that the trend of heavy street algorithm flow began in December 2021, as flows were quickly moving to on-exchange versus off-exchange, and at consistent levels not seen since pre-pandemic2. Now there is a host of reasons for that, not the least of which being spiking volatility and SORs or market makers going directly to exchanges and skipping dark. Year-end risk books getting a bit wider in their markets offered, as they saw the light of end of year performance, could be another contributing factor.
But that trend of heavy algorithmic flows, at levels far outsized to what the overall market volumes are, has been happening in pockets of consistency for the past two and half months. If we take February 7 as an example, some of the LQNT ATS metrics could firmly speak to the fear of block shapes. Then, to follow that up, next day block activity was very strong, improving across all metrics. The total negotiated volumes in the pool jumped 120% day-over-day. The magnitude of the shift speaks to how fluid market volume sources are at the moment, and just how fickle things are.
This brings to the last point, and an affirmation of the prior mentioned drop in retail and institutions activity. Much credit to the heavy tech sell-off early in the year has been given to hedge funds, showing up heavily on prime brokerage weekly or monthly reviews from the big banks.
The chart below shows the trends in notional value traded. As retail heavy names do not tend to be the more expensively priced, this simple trend can speak to more executable volumes to be had (albeit on dropping overall market activity).
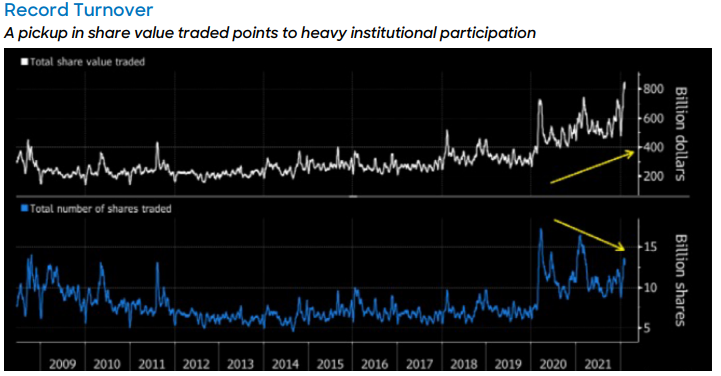
Source: Bloomberg
Looking at our Investment Bank Volume measure as a percentage of overall market volumes, along with the FINRA TRF reported volumes as a percentage, we observe that the FINRA TRF returns to more orderly levels while IB volumes are solid.
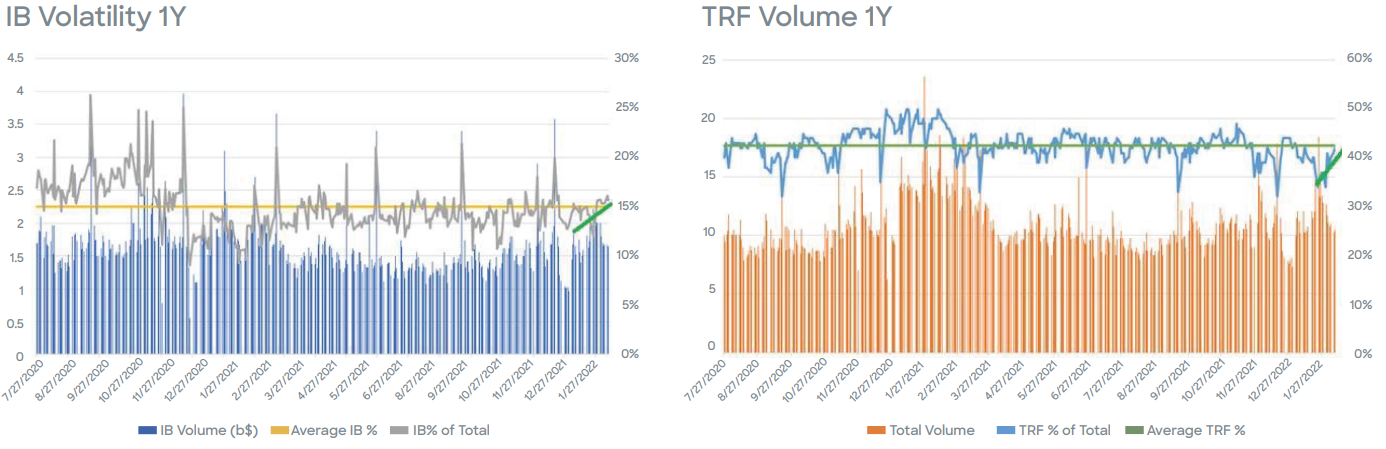
Source: Charts created by Liquidnet personnel based upon data from Bloomberg
Lastly, as the individual situations remain so volatile, particularly during earnings season, simple sentiment readings can be used to help with timing and aggression on a trade. Certain quant funds will look for high standard deviation moves, backed up by volume conviction, to support the notion that momentum will continue.
In the below example, the stock is trading on volume 200% of average and a full 4 standard deviation move (frequency = once every few years). While a fast situation on earnings, there are short term momentum trends that can point to opportunities throughout the day.
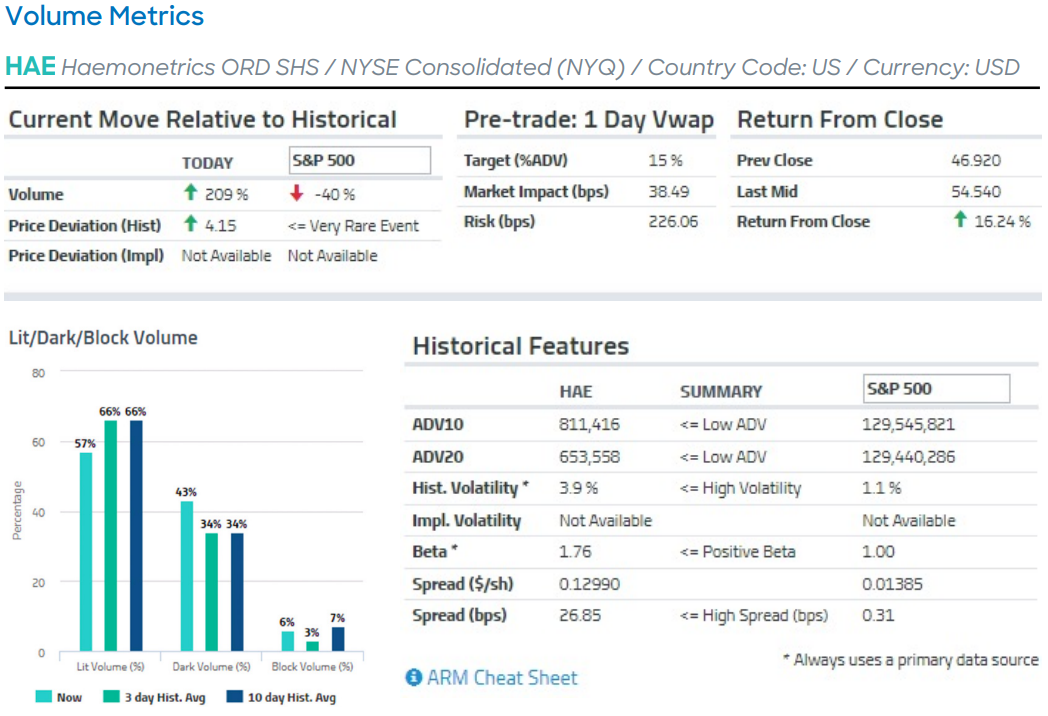
Source: Liquidnet Equity Analytics
Looking at the ATM 3 Sigma chart, purple being Sigma Up3, red Sigma Up2, and yellow Sigma Up1, the trends become evident as the day wears on. Obviously with the help of hindsight, but in real time, can be helpful particularly when the sense of alpha is high.
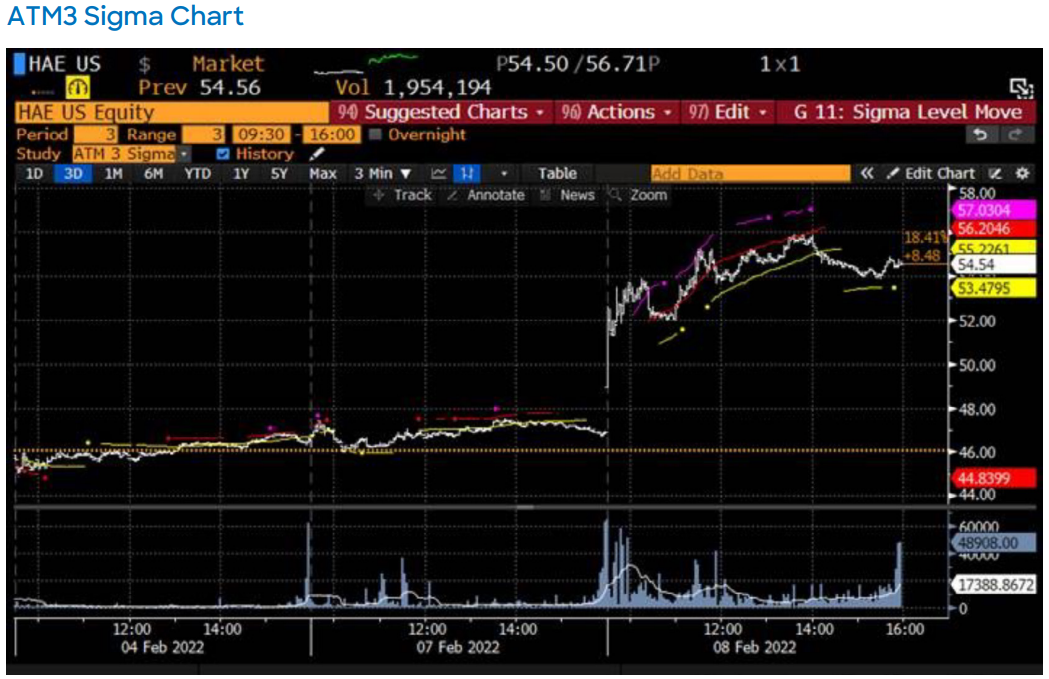
Source: Bloomberg
Written by Jeffrey O’Connor, Senior Execution Consultant, Market Insight Analyst, US Equities
1 https://www.ft.com/content/e4e33332-544b-4633-8b3b-a9594837baf1
2 Based on Bloomberg data. Refer to the TRF Volume chart below