
Defining a Block in the 21st Century
As an industry and in the US, we define a “block” as a sizeable quantity trade that will minimize market impact and information leakage by interacting only with selective orders in the marketplace, i.e., “large orders.”
In practical terms, this means that we generally interact with a small percentage of orders placed in the market―this percentage will vary by stock and market conditions.
The traditional definition of a block has not changed in terms of number of shares since the late 1990s. In fact, we can trace back the origin of this concept to the initial Reg NMS rules about displayed order quantity1.
Today, most traders and venues use the default static value of either 10,000 shares or 5,000 shares to define a block. But is this definition truly reflective of the current market or with one’s objective in “trading a block”?
The evolution of the market
Average trade sizes have decreased and finding true institutional-size liquidity has been challenging in the recent years, resulting in blocks under the traditional definition becoming less frequent. We believe a number of factors have contributed to this evolution, in particular, a significant rise in stock valuations running concurrent with a sharp reduction in stock splits.
The aforementioned combination of reduced stock splits and growth in market capitalization has driven the price of individual stocks to many multiples of where they were ten years ago.
This is where the dichotomy in our market structure becomes an issue. In the US, investors and portfolio managers think of an investment in terms of its dollar value, whereas the trading community thinks in terms of number of shares. For example, one million dollars’ worth of investments yields a much smaller tradable share count today compared to 10 or so years back.
This is exemplified in Figures 1 and 2 below. In absolute terms, the SPX finished at $4,766 in 2021, after closing out at just $1,258 ten years prior in 2011. Meanwhile, the annual number of stock splits within the SPX have been on a decline―2012 saw a ten-year high of 18 splits, whereas 2021 ended with just five. 2022 also saw a number of stock splits, including Alphabet, Amazon and Tesla which have recently announced stock splits. We will continue to watch the impact of these events on their respective changes in block trading activity.
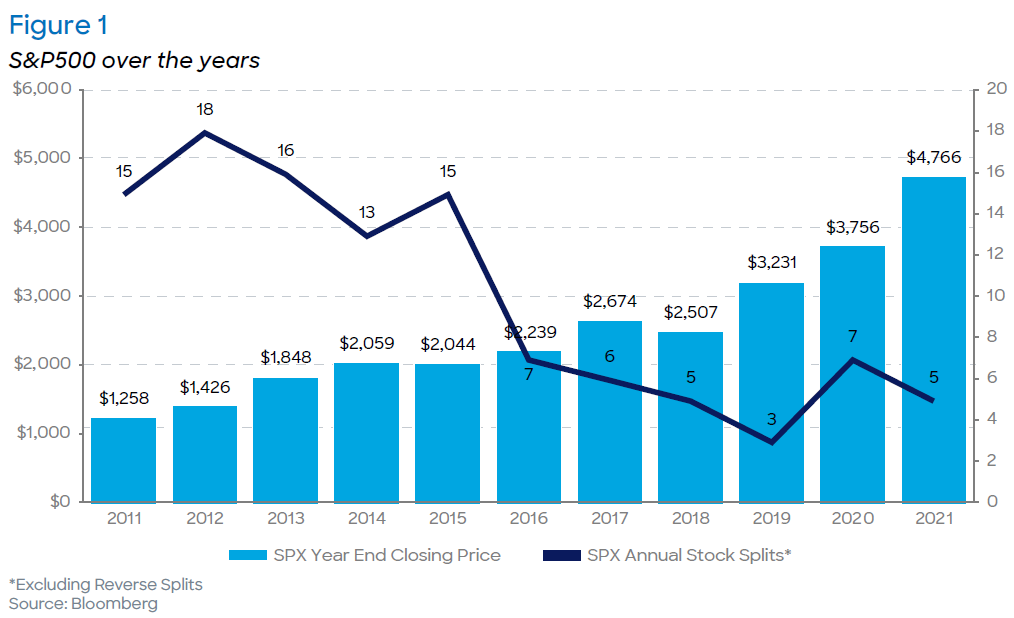
In relative terms, the SPX composite price is up almost 3x from 2011 whereas the annual number of stock splits are a third of what they were in 2011.

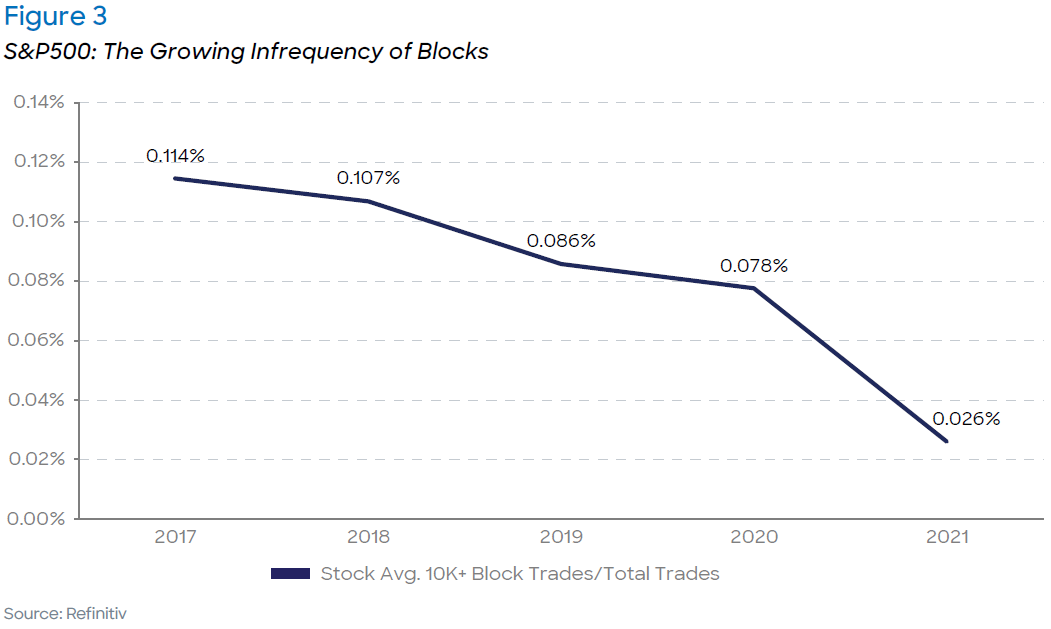
We believe the above factors have resulted in blocks becoming rarer in today’s markets. When using the traditional definition of 10,000+ shares per trade, blocks account on an average of just 0.026% of each S&P500 stock’s trades, down from 0.114% in 2017. This equates to a -77% decline in the frequency of block trading as a percentage of total trading.
The same story holds true when comparing other fixed definitions of blocks, including 2,500+ shares or 5,000+ shares, as shown below on Figure 4.

Our approach
As a company, we believe the best approach to finding institutional-size, quality liquidity (blocks) comes down to the percentage of the available liquidity and number of orders one wishes to interact with in the marketplace‒in other words, how selective do you want to be in who you interact with and the amount of liquidity you want to be exposed to?
In addition to using minimum fill sizes to find institutional size liquidity (in defining a block), we also use them to weed out ‘smaller’ fills which leak information, either due to pinging efforts or by observation of the tape looking for execution patterns. Although a fixed minimum execution size can achieve this goal, it may also keep us from interacting with meaningful liquidity.
It is therefore important to understand the reasoning behind setting a minimum execution size on an order. Is it to protect the order? Or is it to be selective and only look to interact with institutional-size liquidity?
For the purpose of this report, we are focusing on the latter.
There are three factors we believe to be pertinent to consider on an individual stock basis:
The distribution of a stock’s trade size
The frequency of trade sizes per stock
The amount of liquidity across various trade sizes
Figures 5 and Figure 6 below show the percentage of executions and volume one would
interact with if they defined a block at various levels, as well as an expected average trade size.
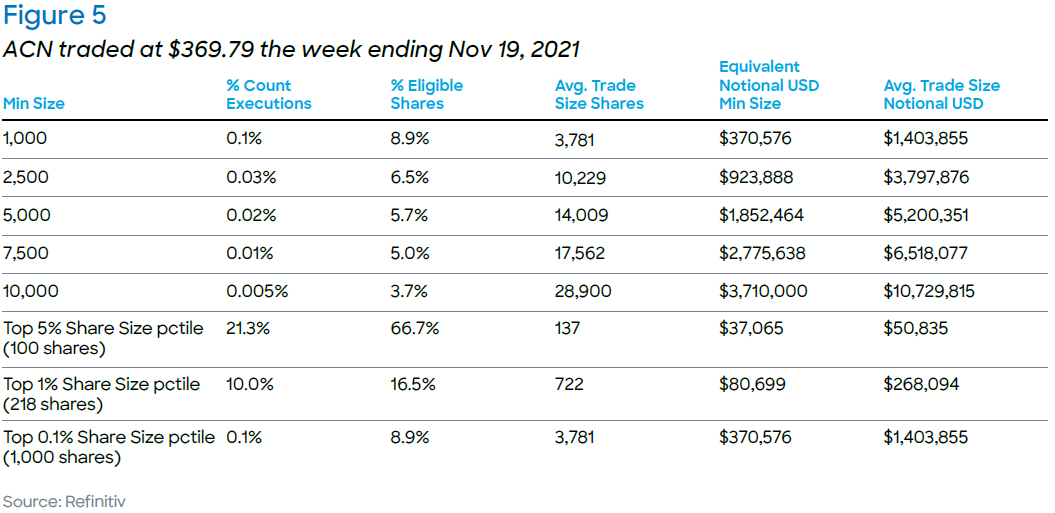
The pitfalls and potential unintended outcomes of using a fixed minimum share size are a small or insufficient exposure to the market. In the case of a high-priced stock like ACN, a 10,000 share minimum fill size would limit the trader to just 0.005% of the executions and 3.7% of the stock’s volume. However, in this example, using a stock-specific block definition, such as setting the minimum execution size based on the stock’s Top 1% trade size, would expose the trader to 16.5% of ACN’s volume while still being selective by participating in just 10% of the stock’s trades over the course of a given day.

When considering a lower-priced stock such as HPE, a similar story plays out. A 10,000-share min fill size would participate in 0.03% of the stock’s daily executions and just 3.1% of the stock’s volume. Meanwhile, a min quantity based on the stock’s Top 1% trade size would expose the trader to 17.5% of the stock’s volume.
If a trader wants to be selective, but not “too” restrictive, they might be happy with defining a block as an execution size of 5,000 shares, or more for HPE. At this level, the trader would only be interacting with 0.1% of the executions in the market (quite selective) but would have exposure to 5.8% of the shares traded. Furthermore, knowing the average trade size with such a minimum would be ~10,105 shares may further confirm this is the not right size print to define a block.
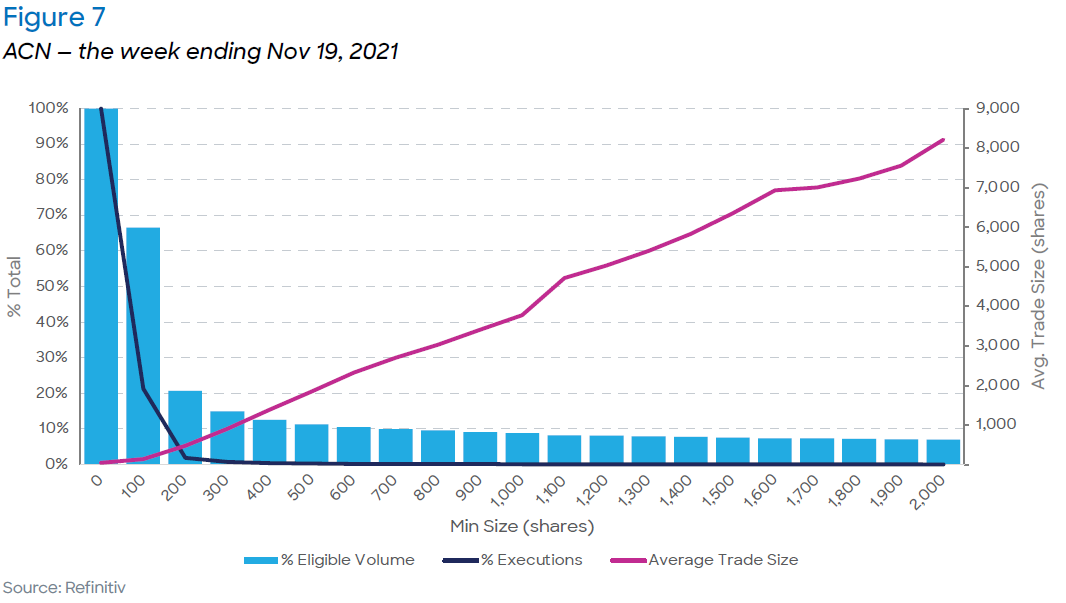
Figures 7 and 8 provide a visual of the exposure to orders and liquidity in the marketplace as the quantity that defines a block increase for tickers ACN and HPE.

How we define a “block” and our proposed methodology
We believe a block quantity is not a static value. It is a value derived dynamically based on your appetite for finding liquidity and the amount of exposure you want to have in the market. Again, when considering the amount of exposure, you are willing to take, you should consider the balance between the percent of orders you want to interact with versus the quantity/value of liquidity. Moreover, this value is stock specific, calling for a dynamic approach for trading blocks.
Our takeaway
The widely held “definition of a block” as being a fixed quantity has held sway for many years. Established in 2005, Reg NMS brought high levels of change in a relatively condensed period of time, with market (and hence liquidity) fragmentation being the most far-reaching impact. This fragmentation, coupled with the surge in stock prices, has resulted in a decrease in average trade size and frequency of large prints in the marketplace.
As it pertains to conditional routing, the utilization of routing and aggregation by broker/dealers gained momentum over the last decade. But as it has evolved, going from skepticism to relatively wide-spread acceptance, the minimum fill size setting on routed orders largely remained steady―i.e. most broker/dealers define a block as 10,000 or 5,000 shares, without due consideration to the specific characteristics of a stock.
It is with this in mind, and through years of watching our Members trade with minimum fill sizes that often were irrelevant to the characteristics of a stock, that we have created a proprietary model. This model optimizes the minimum fill size to ensure appropriate levels of block-seeking per symbol, while preserving the exclusivity of trading with a select few large orders in a particular stock.
It seems odd that the evolutionary change in the marketplace has far outpaced what has been a widely used trading tactic to navigate a complex marketplace. Through Liquidnet’s model, we seek to modernize the block size expectation to reflect what the current reality is.
Written by Jeffrey O’Connor, Head of Equity Market Structure, Americas, and Amar Vaidya, Head of Liquidity Strategy
1 Source: https://www.sec.gov/rules/final/34-51808.pdf
The information provided by Liquidnet is not investment advice nor is it intended as a recommendation to buy, sell or hold any instrument referenced. Any analysis provided is not sufficient upon which to base an investment decision. A recipient should consider its own financial situation and investment objectives and seek independent advice, where appropriate, before making any investment. Although the statements provided by Liquidnet are believed to be correct, they have not been verified and should not be relied upon when considering the merits of any particular investment. All presented data may be subject to slight variations.
The information provided by Liquidnet is for institutional investor use and is intended for the recipient only. Any disclosure, reproduction, distribution or other use of the message or any information generated by the product by an individual or entity other than the intended recipients prohibited. Please contact your Liquidnet coverage for more information about any of the information and analysis provided herein.